- Sign In
- |
- Sign Up
- |
- My Quote (0)
- |
- CART (0)


Capture fast RMS data, show half-cycle and waveforms to characterize electrical system dynamics. Quickly understand the capacity of your existing electrical panels, troubleshoot circuit breaker trips and uncover and monetize energy costs.
Capture fast RMS data, show half-cycle and waveforms to characterize electrical system dynamics. Quickly understand the capacity of your existing electrical panels, troubleshoot circuit breaker trips and uncover and monetize energy costs.
Quickly understand the capacity of your existing electrical panels, troubleshoot circuit breaker trips, and uncover and monetarily quantify energy losses.
Power quality issues may affect the operation of critical loads and impact on your bottom line negatively. Think of this power quality and energy analyzer as an insurance policy. The user can calculate the cost of wasted energy due to poor power quality, and troubleshoot the source of power quality or motor performance issues. Additionally, it's designed to provide the user with the data needed to quickly get to the root of the problem.
* View data locally on the instrument, via Fluke Connect mobile app and PowerLog 430-II desktop software
Traditionally energy savings are achieved by monitoring and targeting, or in other words, by finding the major loads in a facility and optimizing their operation. The cost of power quality could only be quantified in terms of downtime caused by lost production and damage to electrical equipment. The unified power measurement (UPM) method now goes beyond this to achieve energy savings by discovering the energy waste caused by power quality issues. Using the unified power measurement, the energy loss calculator will determine how much money a facility is losing due to waste energy.
Unbalance
UPM gives a more comprehensive breakdown of the energy consumed in the plant. In addition to measuring reactive power (caused by poor power factor), UPM also measures the energy waste caused by unbalance; the effect of unevenly loading each phase in three-phase systems. Unbalance can often be corrected by reconnecting loads on different phases to ensure the current drawn on each phase is as equal as possible. Unbalance can also be corrected by installing an unbalance reactance device (or filter), that will minimize the effects. Correcting unbalance should be basic good housekeeping in the facility as unbalance problems can cause motor failure or shorten equipment life expectancy. Unbalance also wastes energy. Using UPM can minimize or eliminate that energy waste.
Harmonics
UPM also provides details of the energy wasted in your facility due to the presence of harmonics. Harmonics may be present in your facility due to the loads you operate or may be caused by loads in adjacent facilities. The presence of harmonics in your facility can lead to:
Quantifying the cost of wasted energy due to the presence of harmonics simplifies the return-oninvestment calculation needed to justify purchasing harmonic filters. By installing a harmonic filter the ill effects of harmonics can be reduced and energy waste eliminated, resulting in lower operational costs and more reliable operation.
Energy loss calculator - calculate money lost to energy waste in terms of real dollars

It's a simple fact, poor power quality can have a big impact on the bottom line. This power quality analyzer enables you to identify issues and measure energy loss giving you specific insight into the amount of loss in dollars associated with things like effective power and with poor power quality characteristics such as reactive power, unbalance, distortion, or neutral current. The power anlayzer even offers users the flexibility to input cable length and cable diameter so you can calculate loss due to conductor sizing (Or use AUTO mode if you don't know your cable specification) and enter up to four unique time-dependent daily rates (kWh) for more accurate calculations. Armed with this critical data users can easily justify the investment necessary to take countermeasures.
Powerful troubleshooting capabilities
Specifically designed with the needs maintenance engineers and technicians in mind; users who need to get to the solution of the power quality problem as quickly as possible so that they can minimize expensive downtime. The measurement process and display of data is optimized to get to the most important information as quickly as possible. Multiple parameters are measured simultaneously and displayed in formats that quickly describe the state of the power quality of the system. Data can be quickly accessed as simple digital values, trend graphs, waveforms, phasor diagrams or analyzed and organized into tabular format such as the event data where the magnitude, duration and time stamping enable rapid correlation to problems experienced.
AutoTrend - Quickly see the trend
Unique autotrend gives you fast insight into changes over time. Every displayed reading is automatically and continuously recorded without having to set up threshold levels or having to manually start the process. You can quickly view trends in voltage, current, frequency, power, harmonics or flicker on all three phases plus neutral.
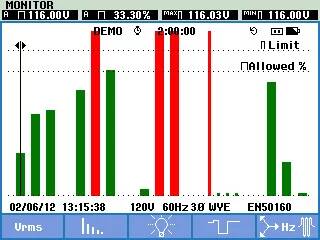
The system - monitor overview screen
Instant insight into whether the voltage, harmonics, flicker, frequency and the number of dips and swells fall outside the set limits. A detailed list is given of all events falling outside the set limits.
For some users, load switching is a cause of power quality problems. When loads switch on, the current draw sometimes causes the voltage to drop to a level that causes other equipment to malfunction. The PowerWave function a enables users to capture voltage, current and frequency signals simultaneously at a high speed to see which interaction is potentially causing problems. PowerWave goes beyond standard power quality measurements; PowerWave's fast data capture mode enables system dynamics to be characterized.
Waveforms for voltage and current are continuously captured for the specified time, and are displayed on screen in high detail; the power waveform is derived from the data. In addition, half-cycle RMS values for voltage, current, power and frequency can be stored and retrieved for analysis. This feature is particularly useful for testing of standby generation systems and UPS systems where reliable switch-on can be vital.

PowerWave data capture - quickly identify how motor and generator startups are impacting equipment performance
With PowerWave data capture you can capture three-phase high resolution voltage and current waveforms for up to five minutes along with detailed RMS voltage and current values. By analyzing the interaction of these values over time you can correlate the effects of voltage, current and frequency during the critical startup of motors and generators. PowerWave even goes beyond the standard power quality measurements allowing you to record half cycle rms values on 8 channels, frequency and instantaneous power (Vrms1/2, Arms1/2, W, Hz and scope waveforms for voltage, amps and watts).
Advanced power quality health - at-a-glance power quality health data in real-time so you have the data you need, when you need it
This power analyzer utilize an integrated power quality health summary that gives you an at-a-glance view of a complete range of power quality issues in real time. With a simple graphical presentation, complete with tolerance limits, you can quickly discover which power quality problems may be present on your electrical system. If you don't know where to start or what problems might exist the advanced power quality health summary will simplify the task.
Power inverter efficiency
Power inverters take DC current and transform it into AC current, or vice versa. Solar generation systems usually include an inverter that takes the DC energy from the solar cells and converts it to useful AC power. Inverters can lose performance over time and need to be checked. By comparing the input power with the output power you can determine the system efficiency. This energy analyzer can measure the efficiency of such inverters by simultaneously measuring the DC and AC power of a system to determine how much power is lost in the conversion process.

With a unique autotrend feature you can get fast insight into changes over time. Every displayed reading is automatically and continuously recorded without having to set up threshold levels or having to manually start the process So you can quickly view trends in voltage, current, frequency, power, harmonics or flicker on all three phases plus neutral.
Unified power measurement
Previously, only experts could calculate how much energy was wasted due to power quality issues; utilities could calculate the cost, but the required measurement process was beyond the reach of average electricians. With this patented unified power function you can use one handheld tool to determine how much power is being wasted, and calculate exactly what the extra consumption costs.
The patented unified power measurement system provides the most comprehensive view of power available, measuring:
These UPM calculations are used to quantify the fiscal cost of energy loss caused by power quality issues. The calculations are computed, along with other facility-specific information by an Energy Loss Calculator that ultimately determines how much money a facility loses due to wasted energy.
SystemMonitor - check performance against EN50160 with ease
The unique system-monitor gives you an overview of power system performance (there is no button or single function) and checks the compliance of incoming power to EN50160 limits or to your own custom specifications. The overview is shown on a single screen, with color-coded bars clearly indicating which parameters fall outside the limits.
Logging function allows you to customize measurement selections and provides instantaneous analysis of user-selectable parameters.
Measure and record power (W), VA and VARs, PF and energy consumption.
Track harmonics up to the 50th, and measure and record THD in accordance with IEC61000-4-7 requirements.
Complete three-phase voltage and current measurements 50% faster! We're confident in this because it's been tested at customer sites. The new clamp meters from Fluke (models 377 FC & 378 FC) feature FieldSense™ technology where voltage and current can be measured simultaneously with the clamp jaw. Meaning, these clamp meters can be used to make sequential line-to-ground measurements and current measurements that result in calculated line-to-line voltage measurements and phase rotation information.
In this application note, we walk you through the old versus the new way of doing phase-to-phase measurements along with step-by-step instructions on how to make these measurements.
Read the Application Note
| Volt | |
| Vrms (AC + DC) | Measurement range: 1 to 1000 V phase to neutral Resolution: 0.01 V Accuracy: ±0.1% of nominal voltage1 |
| Vpk | Measurement range: 1 to 1400 Vpk Resolution: 1 V Accuracy: 5% of nominal voltage |
| Voltage Crest Factor (CF) | Measurement range: 1.0 > 2.8 Resolution 0.01 Accuracy: ±5% |
| Vrms 1/2 | Resolution: 0.1 V Accuracy: ±0.2% of nominal voltage |
Amps |
| i430-Flex 1x | Measurement range: 5 to 6000 A Resolution: 1 A Accuracy: ±0.5% ±5 counts |
| i430-Flex 10x | Measurement range: 0.5 to 600 A Resolution: 0.1 A Accuracy: ±0.5% ±5 counts |
| 1mV/A 1x | Measurement range: 5 to 2000 A Resolution: 1 A Accuracy: ±0.5% ±5 counts |
| 1mV/A 10x | Measurement range: 0.5 to 200 A (AC only) Resolution: 0.1 A Accuracy: ±0.5% ±5 counts |
| i430-Flex | Measurement range: 8400 Apk Resolution: 1 Arms Accuracy: ±5% |
| 1mV/A | Measurement range: 5500 Apk Resolution: 1 Arms Accuracy: ±5% |

 |
 |
 |
|
| Model | Fluke 434-II | Fluke 435-II | Fluke 437-II |
|---|---|---|---|
| Standard compliance | IEC 61000-4-30 Class S | IEC 61000-4-30 Class A | IEC 61000-4-30 Class A |
| Volt Amp Hz | |||
| Dips and swells | |||
| Harmonics | |||
| Power and energy | |||
| Energy loss calculator | |||
| Unbalance | |||
| Monitor | |||
| Inrush | |||
| Event waveform capture | |||
| Flicker | |||
| Transients | |||
| Mains signaling | |||
| Power wave | |||
| Power inverter efficiency | |||
| 400Hz | |||
| C1740 Soft Case | |||
| C437-II Hard Case with rollers | |||
| SD card (Max 32 GB) | 8 GB | 8 GB | 8 GB |
All models include the following accessories TL430 test lead set, 4 x i430 thin flexi current probes, BP290 battery, BC430 power adapter with international power adapter set, USB cable A-B mini and PowerLog CD.
Perform custom analysis and create reports with included software. Measurement data can also be exported to common spreadsheet programs.

Designed to quickly view recorded data, the included Power Log software displays all recorded parameters on interactive trends. Generate a professional report with the 'Report Writer' function, or copy and paste images into report document manually.
FlukeView Power Quality Analyzer Software (SW43W) offers you simple mouse-controlled tools to work with your Power Quality Analyzer.
The FlukeView software communicates with your Power Quality Analyzer via the optically isolated OC4USB adapter/cable connected to the USB of the PC. The OC4USB driver creates a virtual COM port. FlukeView will handle the USB port as a COM port.
Note:
The optional RS-232 adapter/cable PM9080 allows you to communicate via a COM port of your PC.
Click on a category to view a selection of compatible accessories with the Rental – Fluke 435-II 3 Phase Power Quality and Energy Analyzer with Carrying Case.

| Volt | |
| Vrms (AC + DC) | Measurement range: 1 to 1000 V phase to neutral Resolution: 0.01 V Accuracy: ±0.1% of nominal voltage1 |
| Vpk | Measurement range: 1 to 1400 Vpk Resolution: 1 V Accuracy: 5% of nominal voltage |
| Voltage Crest Factor (CF) | Measurement range: 1.0 > 2.8 Resolution 0.01 Accuracy: ±5% |
| Vrms 1/2 | Resolution: 0.1 V Accuracy: ±0.2% of nominal voltage |
Amps |
| i430-Flex 1x | Measurement range: 5 to 6000 A Resolution: 1 A Accuracy: ±0.5% ±5 counts |
| i430-Flex 10x | Measurement range: 0.5 to 600 A Resolution: 0.1 A Accuracy: ±0.5% ±5 counts |
| 1mV/A 1x | Measurement range: 5 to 2000 A Resolution: 1 A Accuracy: ±0.5% ±5 counts |
| 1mV/A 10x | Measurement range: 0.5 to 200 A (AC only) Resolution: 0.1 A Accuracy: ±0.5% ±5 counts |
| i430-Flex | Measurement range: 8400 Apk Resolution: 1 Arms Accuracy: ±5% |
| 1mV/A | Measurement range: 5500 Apk Resolution: 1 Arms Accuracy: ±5% |
|
|
|
|
| Model | Fluke 434-II | Fluke 435-II | Fluke 437-II |
|---|---|---|---|
| Standard compliance | IEC 61000-4-30 Class S | IEC 61000-4-30 Class A | IEC 61000-4-30 Class A |
| Volt Amp Hz | |||
| Dips and swells | |||
| Harmonics | |||
| Power and energy | |||
| Energy loss calculator | |||
| Unbalance | |||
| Monitor | |||
| Inrush | |||
| Event waveform capture | |||
| Flicker | |||
| Transients | |||
| Mains signaling | |||
| Power wave | |||
| Power inverter efficiency | |||
| 400Hz | |||
| C1740 Soft Case | |||
| C437-II Hard Case with rollers | |||
| SD card (Max 32 GB) | 8 GB | 8 GB | 8 GB |
All models include the following accessories TL430 test lead set, 4 x i430 thin flexi current probes, BP290 battery, BC430 power adapter with international power adapter set, USB cable A-B mini and PowerLog CD.
Perform custom analysis and create reports with included software. Measurement data can also be exported to common spreadsheet programs.
Designed to quickly view recorded data, the included Power Log software displays all recorded parameters on interactive trends. Generate a professional report with the 'Report Writer' function, or copy and paste images into report document manually.
FlukeView Power Quality Analyzer Software (SW43W) offers you simple mouse-controlled tools to work with your Power Quality Analyzer.
The FlukeView software communicates with your Power Quality Analyzer via the optically isolated OC4USB adapter/cable connected to the USB of the PC. The OC4USB driver creates a virtual COM port. FlukeView will handle the USB port as a COM port.
Note:
The optional RS-232 adapter/cable PM9080 allows you to communicate via a COM port of your PC.
Click on a category to view a selection of compatible accessories with the Rental – Fluke 435-II 3 Phase Power Quality and Energy Analyzer with Carrying Case.


